How to get a reproducible analysis of a small CSV file out of Claude Code, once with a cloud model and once with gpt-oss:20b on a local Ollama server, and how to check the result independently of the agent. Both runs were correct in the end, the local one required a few adjustments of the setup that are documented here.
Companion to the setup guides Claude Code with LM Studio and Claude Code with Ollama. Those two posts get the agent running, this one is about using it for a small data analysis.
Whenever it comes to analyzing experimental data with a coding agent, the tedious part is not getting a script and a plot, but making sure that the script computes what was intended. Consider a scenario where a CSV file contains measurements from two conditions and the agent is asked for a summary, a comparison and a figure. Claude Code will write the script, install the required packages and come back with a plausible result within minutes. The relevant decisions, i.e. which rows constitute independent samples, how repeated measurements are aggregated, how missing values are handled and what the comparison is supposed to mean, are nevertheless not encoded in the column names and have to be made somewhere.
In this post I use a small synthetic dataset where all of these decisions can be checked by hand, and give the same prompt to Claude Code twice, once with a cloud model (Claude Opus) and once with gpt-oss:20b served by Ollama on a Mac in the next room. Both runs resulted in a correct and reproducible analysis. The local run required a few adjustments of the setup to get there, which are described below, as they are not specific to this example. The data consist of three independent samples per condition, each measured twice. The two measurements are technical repeats of the same sample and not additional samples, and values are in arbitrary units. The file is available as measurements.csv, alternatively save the following twelve rows as The intended analysis is simple in that technical repeats are averaged within each sample and each independent sample then enters the condition mean with equal weight, i.e. the condition mean is the mean of three sample means and not of six measurements. Reported are the treatment-minus-control difference and the percentage change relative to the control mean. There is no significance test, which would not be meaningful with three samples of invented numbers anyway. All of this needs to be part of the instructions, as the column names alone do not tell the agent whether the experiment is paired, whether the values have already been normalized or whether a transformation is intended. In the present case the six sample identifiers denote independent samples and nothing is transformed. The sample means are 10, 12 and 14 for control and 12, 15 and 18 for treatment, which gives the following condition summary. The difference is 3 arbitrary units, the change relative to control is (15 − 12) / 12 = 25 %. These are descriptive numbers for an invented dataset and do not establish any treatment effect. There is one trap in this dataset that I left in on purpose. Since every sample has exactly two measurements, pooling all twelve rows within each condition yields the same means, 12 and 15. Correct means on this balanced dataset therefore do not prove that an implementation respects the sample hierarchy, and one has to check in addition that the script reports three independent samples per condition and keeps the intermediate sample means. A reference implementation that uses nothing but the Python standard library is available as reference_analysis.py. It insists on the specified design (two repeats, three samples), rejects missing, non-finite and duplicated rows, unknown conditions and samples assigned to two conditions, and writes The outputs of the agent are compared against these values rather than asking the agent whether its result looks right. The reference only establishes the numbers, and whether a given model arrives at an equivalent script is a different question, which the two runs below are about. Claude Code was started in a directory that contained nothing but This is a specification of the calculation and not a request to come up with an analysis. The last sentence is the important one, as reviewing the plan is the moment where a wrong grouping decision can still be caught before it ends up in a polished figure. Both runs used Claude Code 2.1.310 in non-interactive mode ( In the first turn (22 seconds) the agent listed the directory, printed the CSV, checked In the second turn (153 seconds) the agent wrote The third turn (144 seconds) followed after I had installed matplotlib 3.11.2 into the environment. The agent replaced the SVG code with a matplotlib dot plot, rendered it, looked at the image, noticed that the line marking the condition mean ran through the labels of C2 and T2, moved the line to the right of the dots, and tested a throwaway file in which two samples have the same mean to make sure the dots are offset rather than stacked. matplotlib and its eleven dependencies were pinned in The three turns cost USD 2.53 and took a little over five minutes of model time, the test runs themselves account for about 20 seconds of that. Independently of the agent, I then verified that the script gives the reference numbers when run in a clean directory, that the sample means agree with the reference file, that the 22 tests pass, that a shuffled copy of the input yields an identical summary, and that copies with a The second run used the same prompt and the same Claude Code, with In the first turn (63 seconds) the agent located the file via Glob, read it and wrote a seven-step plan that was correct where it matters. The validation list was complete (missing and non-finite values, duplicated sample/repeat pairs, unknown conditions, samples appearing under two conditions), sample means come first, the condition summary counts unique sample identifiers rather than rows, and difference and percentage change were defined correctly. The plan also noted that the units were unspecified and proposed a generic axis label, which is where I would have provided the units anyway. Two things were wrong, and both were visible before any code existed. The example README pinned In the second turn (228 seconds) the agent received the same answers as the cloud model, plus the sentence "pin the versions that are actually installed, not guessed ones" and the instruction to create the files with the Write tool. It ran The checks were the same as for the cloud run. The script yields sample means of 10, 12, 14, 12, 15 and 18, condition means of 12 and 15 with three samples each, the shuffled copy gives the identical summary, the copy with a The run above was my third attempt with this model. The first two attempts failed, and it turned out that every one of these failures was a setup problem rather than a reasoning problem, with a simple fix each. The first attempt ran in a scratch directory with a path of more than 100 characters. The first tool call of the model was a Read with that path, where it had replaced the middle part of the directory name with an ellipsis. The file was consequently not found, and instead of retrying with the relative path suggested by the error message, the model wrote a plan for a file it had never seen, with invented column names and packages that were not installed. The fix is a working directory with a short path, which is what one would use anyway outside such an experiment. Moreover, this attempt ran with the full tool list of the Claude Code installation on my laptop, including several MCP servers, which adds several thousand tokens of tool descriptions to every request (the first request of that attempt had 12.5K tokens, against 4.7K with the reduced tool list) and leaves correspondingly less room in a 32K context for the actual work. The The second attempt, from a short path and with the reduced tool list but still at 32K, read the file and produced a correct plan in 52 seconds. It then printed the script into the chat as a code block instead of creating a file, together with a note that I should copy it into In practical terms, the local run needed four things. A working directory with a short path, a 64K context on the server together with For comparison I gave the same prompt and setup once to Regardless of which model produced the script, the checks are the same. The figure must show six sample means, three per condition, with the aggregation stated in the caption, and if technical repeats are shown as well, they must be distinguishable from sample means. An error bar whose meaning the reader has to guess is worse than none. The failure cases are tried on disposable copies of the CSV. Agreement with the reference checks the arithmetic, shuffling checks that grouping does not depend on input order, and the rejected inputs check that the program refuses to answer a different question than the one specified. The three checks catch different mistakes, and passing one says nothing about the other two. In this exercise, the duplicate check was the one that caught the actual bugs, in each case in a script that was correct on clean data. The deliverable is a small directory with the unchanged input, the script, the intermediate sample means, the summary, the figure, the tests (if any) and a README with the exact commands and the versions used. The last step is to rerun the saved script in a clean output directory without asking the agent to fix anything. If reproduction depends on undocumented edits, or on the agent remembering what happened in the conversation, the analysis is not self-contained yet. Both runs ended with such a directory. The cloud model asked the one question I had left open and wrote tests on its own initiative, at a cost of USD 2.53 for the session. The local model got there with a better setup and one explicit instruction, in about the same time and at no cost per run, on hardware many labs already have. In both cases the scientific decisions had to come from me, the answer had to be established outside the agent, and the result needed a check that did not rely on the agent's own assurance. Twelve rows are sufficient to practise this. Tested with Claude Code 2.1.310 on macOS, Python 3.15.1, matplotlib 3.11.2 and pandas 3.1.0, with claude-opus-5-5 through a claude.ai login as the cloud model and gpt-oss:20b and qwen3-coder:30b on Ollama 0.40.2 as the local models. Transcripts of all runs were kept and all numbers above come from them.Data and intended analysis
measurements.csv.sample_id,condition,technical_repeat,value
C1,control,1,9
C1,control,2,11
C2,control,1,11
C2,control,2,13
C3,control,1,13
C3,control,2,15
T1,treatment,1,11
T1,treatment,2,13
T2,treatment,1,14
T2,treatment,2,16
T3,treatment,1,17
T3,treatment,2,19
Reference calculation
condition   independent samples   mean of sample means
control     3                     12
treatment   3                     15
sample_means.csv and summary.csv next to the input.python3 reference_analysis.py
Difference: 3.00
Change relative to control: 25.00%
Prompt and setup
measurements.csv with the following prompt.Read measurements.csv and explain its columns before making changes. There are
three independent samples in each of two conditions, with two technical repeats
per sample. Average technical repeats within each sample, then calculate the mean
across independent samples for each condition. Report sample counts, the
treatment-minus-control difference, and percentage change relative to the control
mean. Do not perform a significance test. Reject missing or non-finite values,
repeated sample/repeat identifiers, unknown conditions, and samples assigned to
more than one condition. Do not change the input data. Save the sample means and
condition summary as CSV files. Create a plot showing every independent sample
mean and clearly label the units. Include a README with the exact commands and
dependency versions needed to reproduce the outputs. Show me the analysis plan
before implementing it.
claude -p), such that the complete transcript ends up on disk, with file edits allowed and shell commands restricted to Python, pip and a few read-only tools, and prompt and data were identical in both runs. After the plan, both models got the same answer, i.e. that the units are arbitrary, that a Python environment may be used and that the design is fixed, so the script has to stop with an error if the repeat or sample counts deviate from the specification.Cloud run with Claude Opus
python3 --version and whether pandas and matplotlib were installed (they were not) and came back with a plan instead of code. The plan had the sample hierarchy right, with sample means first and condition means with n equal to the number of independent samples, and it computed the expected result by hand (12 vs. 15, difference 3, change 25 %) before writing any code. It then asked three questions, namely what the units are, whether it may create a virtual environment and install matplotlib, and whether the script should also reject a sample with a different number of repeats or a condition with a different number of samples, as my prompt did not cover these cases. The third question is a good one, as the prompt states the design without saying whether a deviation from it is an error, and the agent noticed this gap before implementing anything.analyze.py with validation and calculations in the standard library, ran it, compared the printed numbers to its own hand calculation and added 22 unit tests, covering the expected result, row order, a byte-for-byte check that the input file is unchanged after a run, and one test per rejection rule. The sandbox I ran it in blocked the pip install, hence matplotlib was not available. The agent reported this, wrote the plot as an SVG by hand instead and remarked that nobody had looked at the figure yet, as it could not render the file either. This is clearly preferable to silently delivering no figure at all.requirements.txt and the README commands updated accordingly.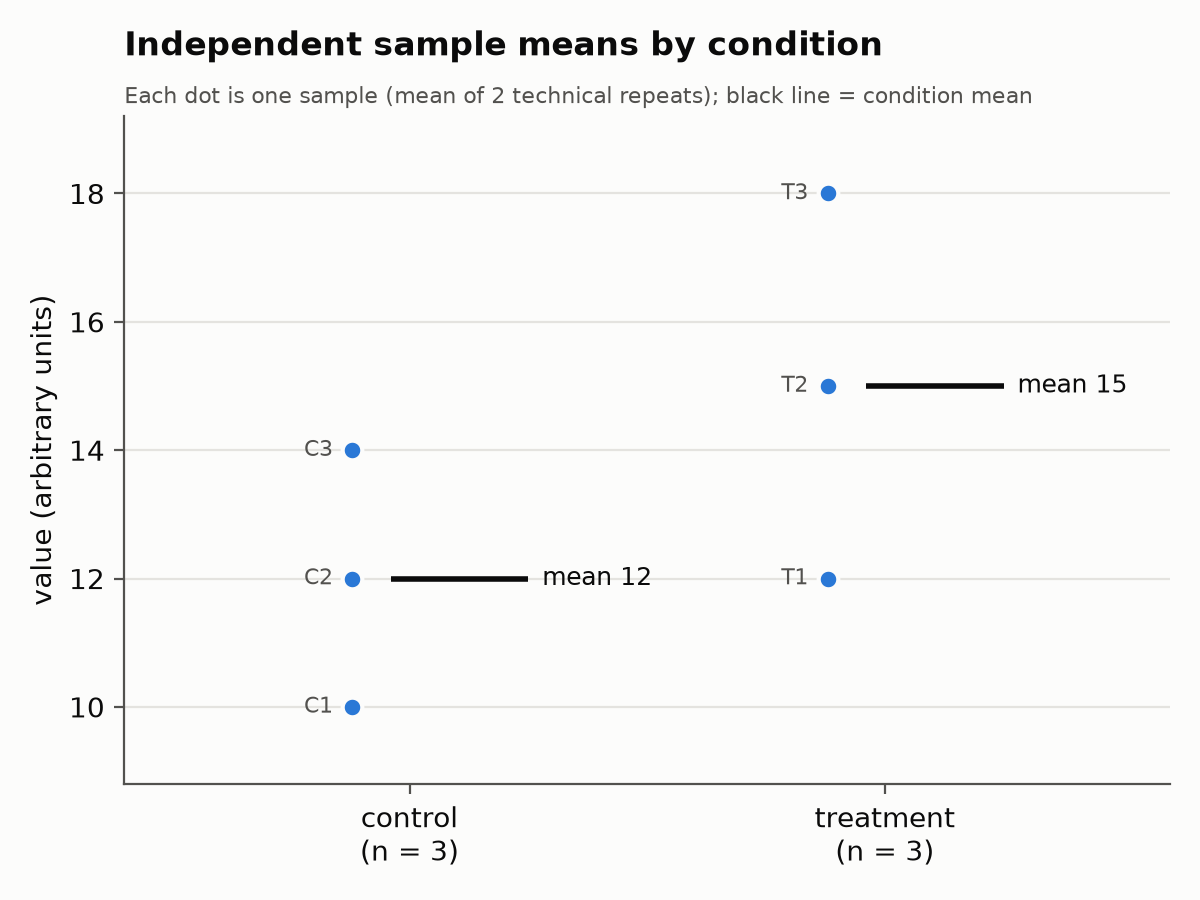
NaN value or a duplicated row are rejected with the offending line number and without writing any output. The checksum of the input file is unchanged.Local run with gpt-oss:20b on Ollama
gpt-oss:20b served by Ollama 0.40 on a 24 GB M4 Pro, i.e. the setup from the Ollama guide. The model needs about 12 GB of memory with a 32K context (the figure measured for the Ollama guide) and was loaded here with a 64K context (see below for why 32K is not enough). The working directory was ~/tmp/a1/gpt-oss-64k, a virtual environment with matplotlib 3.11.2 and pandas 3.1.0 was first in the PATH, and Claude Code was started with a reduced tool set (read, write, edit, search and shell) and without the MCP servers configured on my laptop.export ANTHROPIC_BASE_URL=http://desktop.local:11434 # the Ollama machine, see the Ollama guide
export ANTHROPIC_AUTH_TOKEN=ollama ANTHROPIC_API_KEY=""
export ANTHROPIC_DEFAULT_HAIKU_MODEL=gpt-oss:20b
export ANTHROPIC_DEFAULT_SONNET_MODEL=gpt-oss:20b
export ANTHROPIC_DEFAULT_OPUS_MODEL=gpt-oss:20b
export CLAUDE_CODE_MAX_CONTEXT_TOKENS=65536
claude --model gpt-oss:20b --tools "Read,Write,Edit,Glob,Grep,Bash" --strict-mcp-config
pandas==1.5.3 and matplotlib==3.7.1, versions the model had made up, and the model did not ask any questions. A smaller model does not ask, so the review of the plan has to supply what a larger model would have asked for.pip list --format=freeze and took the real versions from there, wrote analysis.py and a README, ran the script and read the two CSV files it had produced. On reading them it noticed that difference and percentage change appeared in both rows of the condition summary, edited the script such that the two columns are only filled for the treatment row, ran it again and read the files a second time. This amounted to 13 tool calls without any intervention from my side.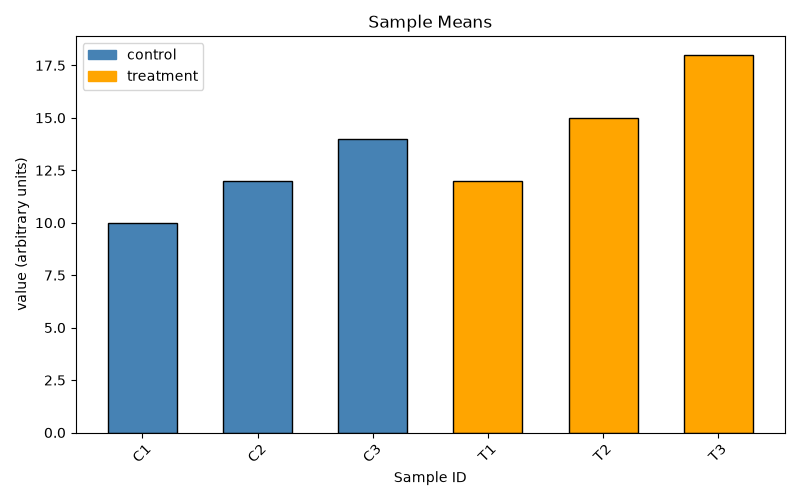
NaN stops with "Missing value(s) found", the copy with a duplicated row stops and prints the two offending rows, nothing is written in either case, and the checksum of the input is unchanged. The README lists the three packages with the versions that were in fact installed. The agent wrote no tests (the prompt did not ask for them), and the condition summary leaves the difference columns empty for the control row, which the README does not explain. These are the two things I would ask for in a third turn. The whole run took about five minutes of wall time and did not cost anything apart from electricity.Prerequisites for the local run
--tools and --strict-mcp-config flags in the command above take care of that.analyze_measurements.py myself. The printed version moreover counted rows instead of samples in its three-samples-per-condition check and would have rejected the valid dataset. When told to use the Write tool and pointed to the counting error, the model created the file, fixed the check, ran the script and produced the right numbers, and then stopped with the message "Prompt is too long, automatic compaction failed". The conversation was nowhere near 32K tokens at this point (the largest request of the session had 12.5K), however, Claude Code keeps a large reserve for the model's reply and with a 32K window starts compacting the conversation early, and the compaction produced an empty summary. With 64K on both the server and in Claude Code the same session went through without any compaction. The script left behind by the second attempt rejected the NaN copy but not the duplicated row, as it tested for distinct repeat numbers per sample rather than for repeated rows. On the duplicate copy it reported a control mean of 11.889 and exited normally. This is exactly the kind of bug the failure-case checks are meant to find, and it did not survive into the third attempt.CLAUDE_CODE_MAX_CONTEXT_TOKENS set accordingly (a 32K window leaves Claude Code too little room once it has reserved space for the reply), no MCP servers and unused tools in the system prompt, and an explicit instruction to create files and run them, as a 20B model is more likely than a large one to answer with a code block. With these in place, gpt-oss:20b did the job in two turns and the result passed every check.qwen3-coder:30b, the other model recommended in the Ollama guide, which needs 22 GB at 64K and runs with a tenth of its weights on the CPU on that machine (an earlier attempt at 32K ended in the same compaction failure as the gpt-oss attempt and is not discussed further). It behaved rather differently in that it ignored the request to show the plan first and started writing files within the first minute. It got sample means and condition means right and reported three samples per condition, but spread the work over three scripts, printed the number of missing values instead of rejecting them, ended both plotting scripts with plt.show(), which blocks without a display until Claude Code gives up on the command, and eventually crashed the session by trying to look at its own PNG, which a text-only model cannot do. On the NaN and duplicate copies its analysis runs through and reports 22.2 % and 26.2 %, respectively. This is one attempt and not a verdict on the model, but it illustrates the other failure mode, i.e. a script that is correct on clean data and answers a different question on flawed data, and it is the failure-case checks and not the correct numbers that reveal it.Checking the results
# order must not matter
(head -1 measurements.csv; tail -n +2 measurements.csv | sort -R) > shuffled.csv
# a missing number must stop the run, not shrink the dataset
sed 's/^T2,treatment,2,16/T2,treatment,2,NaN/' measurements.csv > nan.csv
# a duplicated row must stop the run
(cat measurements.csv; echo "C1,control,1,9") > dup.csv
Reproducibility