How to read the output of RNAfold in the ViennaRNA Package, i.e. the minimum free energy structure, the pair probabilities, the centroid and MEA structures, the suboptimal structures from RNAsubopt, and how to tell whether an MFE structure is a robust prediction or one of many that the sequence could form. Worked example with yeast tRNA-Phe, all commands included.
ViennaRNA in practice, a series of tutorials. RNAfold (this post) · SHAPE and chemical probing data in RNA structure prediction
Whenever it comes to RNA secondary structure prediction, RNAfold is the program most people have in mind when they say that they folded a sequence with ViennaRNA. It takes an RNA sequence and returns a secondary structure, i.e. a list of base pairs, and what it returns by default is the minimum free energy (MFE) structure, the single arrangement of base pairs with the lowest free energy under the nearest-neighbor energy model. This structure is a useful first answer, and in many cases it is also the wrong place to stop. In this post I go through what RNAfold computes, how to read each line of its output, and how one can tell whether the MFE structure is a robust prediction or one of many structures that the sequence could form. All commands were run with ViennaRNA 2.7.2 and all outputs are shown as produced.
The example is yeast phenylalanine tRNA (tRNA-Phe), 76 nucleotides long. Its cloverleaf structure has been known since the 1960s, hence the program can be checked against a fact, and the same sequence is used in the companion post on probing data. Either of the following gives you RNAfold together with the other programs of the package. Source packages and binaries for Linux and Windows are available from the ViennaRNA website, and Put the sequence in a FASTA file. The first word after RNAfold accepts T as well as U, and upper or lower case letters. The third line is the structure in dot-bracket notation, where a pair of matching brackets denotes a base pair and a dot an unpaired base. Read from the outside in, positions 1 to 7 pair with 66 to 72 (the acceptor stem), 10 to 13 with 22 to 25 (the D stem), 27 to 31 with 39 to 43 (the anticodon stem, with the anticodon in the loop at 34 to 36), and 49 to 53 with 61 to 65 (the T stem). The number in parentheses is the free energy of this structure in kcal/mol relative to the unfolded chain, and more negative means more stable. This is the cloverleaf, so far the program agrees with the textbook. RNAfold moreover writes RNAeval computes the free energy of a structure that is given as input, without any search for the optimum. This is the way to compare a predicted structure with a known or a proposed one. For tRNA-Phe the cloverleaf evaluates to -22.40 kcal/mol, identical to the MFE, which confirms that the two structures are the same. When they differ, the energy gap between the MFE structure and the structure under consideration is the first number to look at. A gap of a few tenths of a kcal/mol means that the model cannot practically distinguish the two. An RNA molecule in solution is not a single structure. It is a population that is distributed over many structures, each with a probability that depends on its free energy, i.e. the Boltzmann ensemble. The MFE structure is the single most probable one, however, most probable can mean 60 % or 0.6 %. RNAfold computes the whole distribution by means of the partition function with the option The output now has five lines of results, which I go through one by one. The third line is the MFE structure as before. The fourth line is a pseudo dot-bracket string that summarizes the pair probabilities of every base, followed by the ensemble free energy in square brackets. A dot marks a base that is unpaired in more than two thirds of the ensemble, a round bracket a base that is paired (with whatever partner) in the direction indicated by the bracket in more than two thirds of the ensemble, and a comma a base that is more often unpaired than paired. Curly braces mark bases that are more often paired than unpaired with a clear preference for the direction, and a vertical bar marks a base that is more often paired than unpaired without such a preference. The ensemble free energy of -24.13 kcal/mol is always lower than the MFE, as it sums over all structures. The fifth line is the centroid structure in braces, with its free energy and The sixth line is the maximum expected accuracy (MEA) structure, i.e. the structure that maximizes the expected number of correctly predicted bases given the pair probabilities. It is a compromise between MFE and centroid, and for this sequence it is neither the cloverleaf nor anything close to it. The last line contains two summary numbers, the first of which is the frequency of the MFE structure in the ensemble. A value of 0.06 means that six percent of the molecules would be in the cloverleaf at any moment if the model were exact. The ensemble diversity of 23.4 is the mean base pair distance between two structures drawn from the ensemble, and for a 76 nucleotide RNA with 21 pairs in its MFE structure this is a very wide distribution. In practical terms, the first answer of RNAfold was correct, and its second answer says that the first one is only weakly supported by the model, and both statements are true at the same time. The thermodynamic model of an unmodified tRNA sequence in the absence of magnesium and tertiary interactions does not strongly prefer the cloverleaf, whereas the real molecule folds into it with the help of modified nucleotides, ions and the tertiary contacts between the D and T loops that a secondary structure model does not contain. The option The same numbers are contained in the PostScript file as text. Each line ending in Only ten pairs have a probability above one half, and only the six inner pairs of the acceptor stem are near certain. The three pairs at 0.55 (13 to 34, 14 to 33 and 15 to 32) are not even part of the MFE structure, they belong to the alternative D arm that shows up again below. The anticodon stem and the T stem, which are in the MFE structure, are each below 50 %. This is the picture to keep in mind whenever a single dot-bracket string is used as the structure of a sequence, as the string hides which of its pairs are solid and which are one alternative among several. RNAsubopt enumerates all suboptimal structures within an energy window above the MFE, and Within 1.5 kcal/mol of the optimum there are 39 structures. The second one differs from the cloverleaf by a single additional pair in the anticodon loop, whereas the third one (at -22.10 kcal/mol, i.e. 0.3 kcal/mol above the MFE) has a completely different D arm and anticodon arm. The uncertainty of the energy model itself is of the order of 0.5 to 1 kcal/mol per structure, hence structures this close in energy cannot be told apart by the model. Whenever RNAsubopt returns dozens of structures within a kcal or two, the MFE structure is a representative of a family of structures rather than a prediction of one. Two options are worth knowing from the start, as both change the answer. The option The option Installation
conda install -c bioconda viennarna      # conda or mamba
brew install brewsci/bio/viennarna       # Homebrew on macOS, from the brewsci/bio tap
pip install ViennaRNA installs the Python bindings only, i.e. without the command line tools. RNAfold --version shows which version is installed.The example sequence
> becomes the prefix of the plot files that RNAfold writes.>tRNA-Phe
GCGGAUUUAGCUCAGUUGGGAGAGCGCCAGACUGAAGAUCUGGAGGUCCUGUGUUCGAUCCACAGAAUUCGCACCA
The minimum free energy structure
RNAfold < tRNA.fa
>tRNA-Phe
GCGGAUUUAGCUCAGUUGGGAGAGCGCCAGACUGAAGAUCUGGAGGUCCUGUGUUCGAUCCACAGAAUUCGCACCA
(((((((..((((........)))).(((((.......))))).....(((((.......)))))))))))).... (-22.40)
tRNA-Phe_ss.ps, a PostScript drawing of the structure. The option --noPS suppresses it in case one only wants the text output.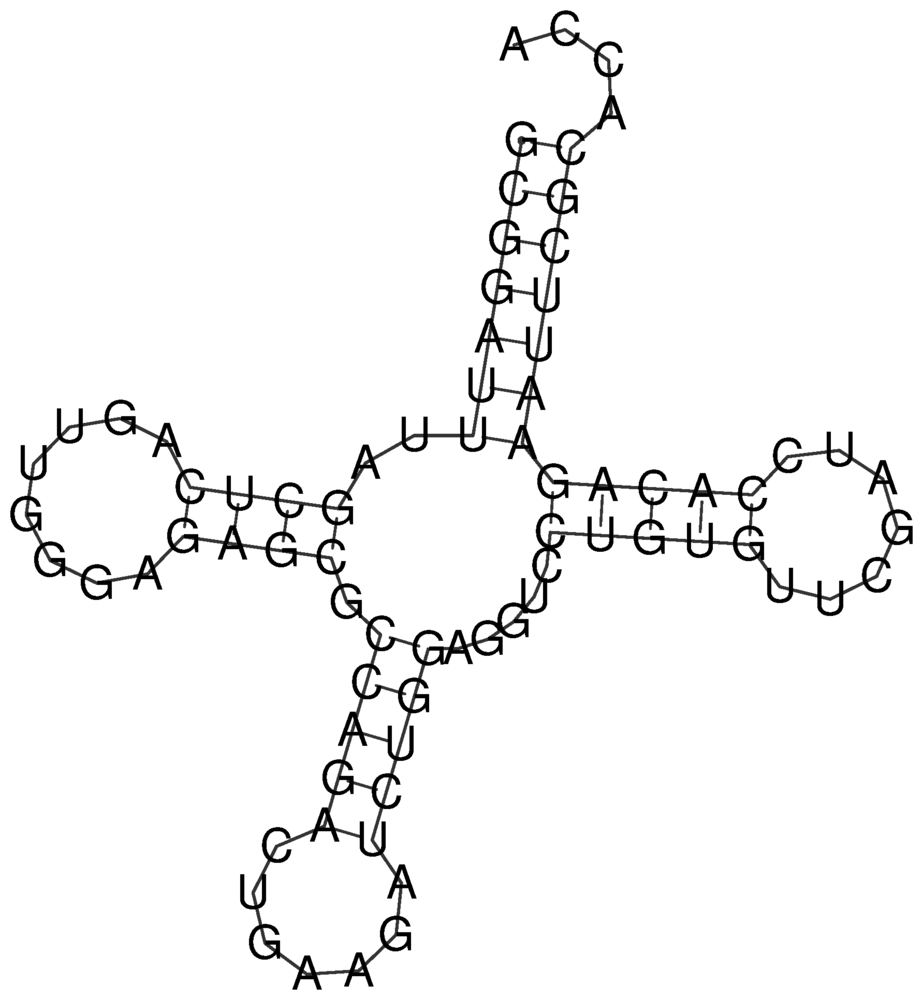
tRNA-Phe_ss.ps written by RNAfold, converted to PNG.The energy of a given structure
printf '%s\n%s\n' GCGGAUUUAGCUCAGUUGGGAGAGCGCCAGACUGAAGAUCUGGAGGUCCUGUGUUCGAUCCACAGAAUUCGCACCA \
'(((((((..((((........)))).(((((.......))))).....(((((.......))))))))))))....' | RNAeval
GCGGAUUUAGCUCAGUUGGGAGAGCGCCAGACUGAAGAUCUGGAGGUCCUGUGUUCGAUCCACAGAAUUCGCACCA
(((((((..((((........)))).(((((.......))))).....(((((.......)))))))))))).... (-22.40)
The thermodynamic ensemble
-p. Adding --MEA produces one more structure that is explained below.RNAfold -p --MEA < tRNA.fa
>tRNA-Phe
GCGGAUUUAGCUCAGUUGGGAGAGCGCCAGACUGAAGAUCUGGAGGUCCUGUGUUCGAUCCACAGAAUUCGCACCA
(((((((..((((........)))).(((((.......))))).....(((((.......)))))))))))).... (-22.40)
(((((({...,(({{{{,({.,,,,.||,||}}},.,.||||..||||,,{{{...,,}}}})))))))))).... [-24.13]
(((((((.....(((................)))...............................))))))).... { -3.01 d=16.21}
(((((((....((((((.((......)).))))))....((.........(((.......)))))))))))).... {-12.10 MEA=46.96}
frequency of mfe structure in ensemble 0.060652; ensemble diversity 23.38
d, its mean base pair distance to the ensemble. The centroid contains exactly those pairs that occur in more than half of the ensemble. For tRNA-Phe these are the seven pairs of the acceptor stem and three pairs (13-34, 14-33 and 15-32) of an alternative D arm that is not part of the cloverleaf, and nothing else, such that a structure drawn at random from the ensemble differs from the centroid by 16 pairs on average.Pair probabilities and the dot plot
-p also writes tRNA-Phe_dp.ps, the dot plot. It is a square grid with a box at position (i, j) in the upper right triangle whose area is proportional to the probability that base i pairs with base j, and one box for each pair of the MFE structure in the lower left triangle.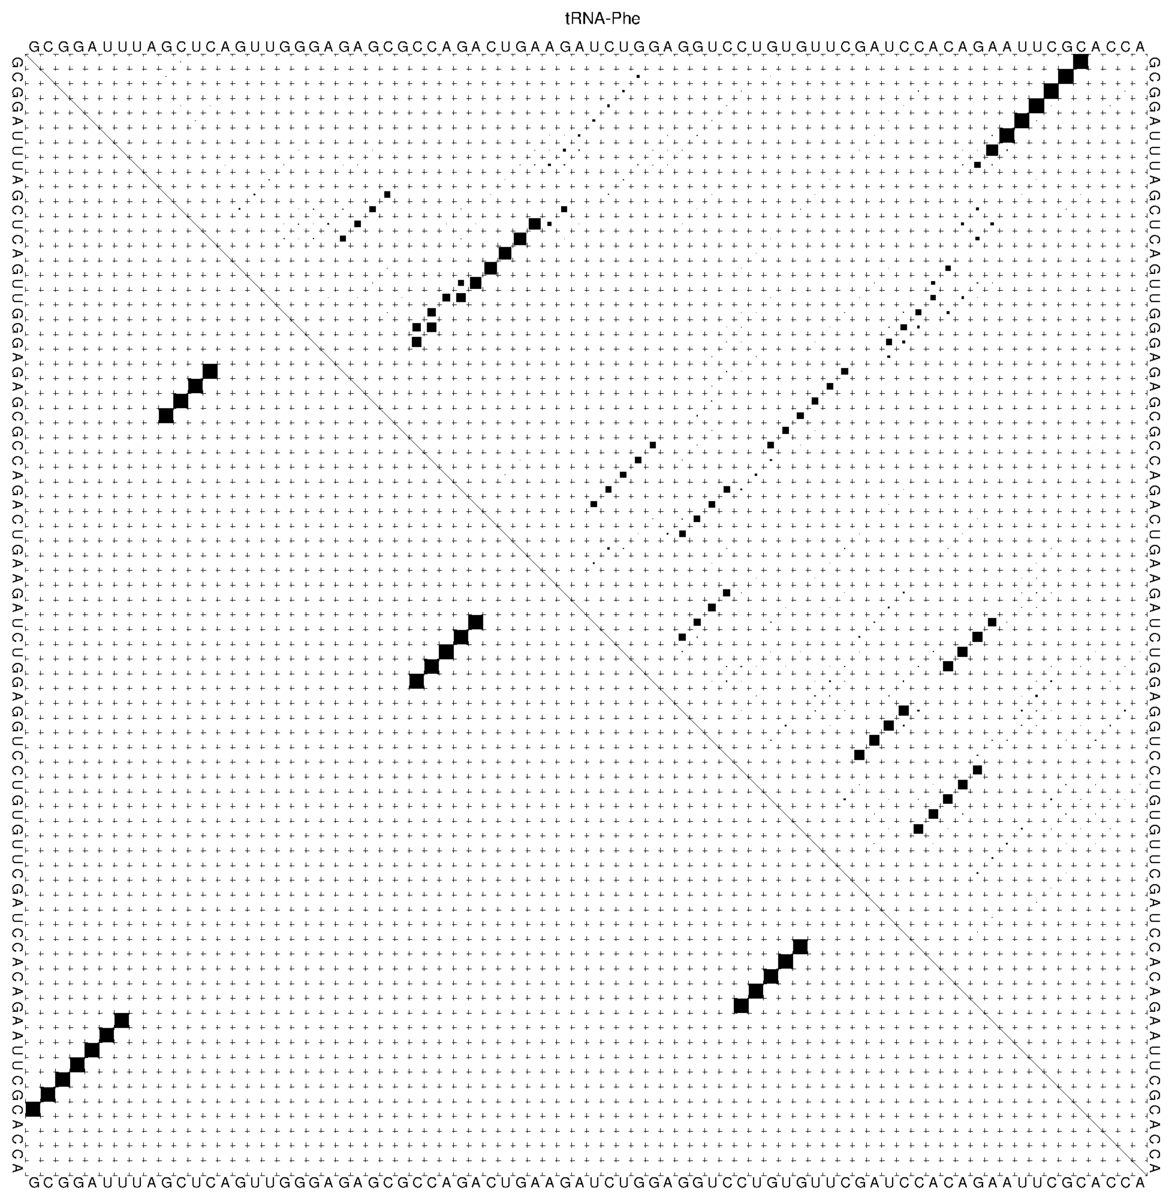
tRNA-Phe_dp.ps. The four helices of the MFE structure appear as four diagonals in the lower left triangle, whereas the upper right triangle shows that only the acceptor stem is near certain and that the D arm and the anticodon arm have several alternatives.ubox holds i, j and the square root of the pair probability, so the pairs above a given probability can be extracted with a one-liner.grep 'ubox$' tRNA-Phe_dp.ps | awk '{p=$3*$3; if (p>0.5) printf "%d %d %.2f\n", $1, $2, p}' | sort -k3 -rn
3 70 0.98
2 71 0.98
1 72 0.98
4 69 0.97
5 68 0.96
6 67 0.92
7 66 0.61
15 32 0.55
14 33 0.55
13 34 0.55
Suboptimal structures
-s sorts them by energy.RNAsubopt -e 1.5 -s < tRNA.fa
(((((((..((((........)))).(((((.......))))).....(((((.......)))))))))))).... -22.40
(((((((..((((........)))).((((((....).))))).....(((((.......)))))))))))).... -22.10
(((((((....((((((.((......)).)))))).((((....))))(((((.......)))))))))))).... -22.10
Temperature and isolated base pairs
-T sets the temperature in degrees Celsius (default 37). The energy parameters were measured at 37 °C and are extrapolated to other temperatures. At 25 °C the MFE structure of tRNA-Phe is already a different one, namely the third suboptimal structure from above, with the alternative D arm and anticodon arm.RNAfold -T 25 --noPS < tRNA.fa
(((((((....((((((.((......)).)))))).((((....))))(((((.......)))))))))))).... (-29.37)
--noLP forbids isolated base pairs, i.e. helices of length one, which are rarely real. For tRNA-Phe the MFE structure stays the same, the ensemble nevertheless becomes slightly narrower (MFE frequency 0.085 instead of 0.061, ensemble diversity 21.7 instead of 23.4), as a number of implausible alternatives are removed. For many sequences the effect is larger, and the calculation is faster. It is a reasonable default for sequences longer than a few hundred nucleotides.Practical consequences
-p, i.e. the MFE frequency and the ensemble diversity. A frequency above 0.3 to 0.5 together with a small diversity indicates one dominant structure, whereas a frequency of a few percent means that the sequence is structurally heterogeneous, whatever the dot-bracket string suggests.Further reading
RNAfold --detailed-help).